Long-term compounding can take longer than you think
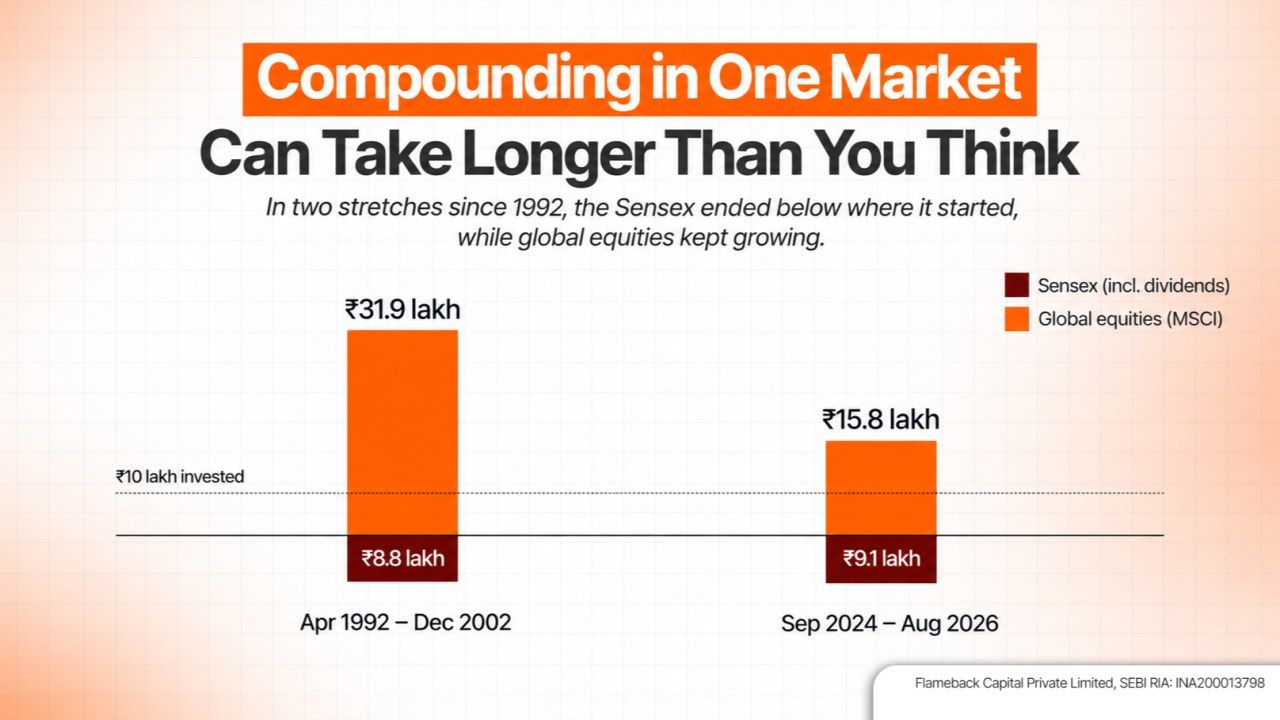
Twice since 1992 the Sensex has spent years below where it started while global equities kept growing. The lesson is diversification, not a case against India.
By Ashrith Rao, Fund Manager, Flameback Capital
· 4 min read
If you are investing in Indian equities, the last couple of years may have been frustrating, especially if you expected your money to compound every year.
For investors, the question is not simply when the market will recover, but what their capital could have earned elsewhere while they wait.
The Sensex closed at 72,480.29 on 30 September 2026, roughly 16% below its September 2024 peak.
Indian equities have disappointed investors before. The Sensex peaked at 4,467 in April 1992. More than ten years later, at the end of December 2002, it stood at 3,377.28, about 24% lower.
What could investors have earned elsewhere during such a prolonged period?
To explore this, I compared three hypothetical portfolios, each starting with ₹10 lakh:
- The Sensex (including dividends)
- Global equities converted to rupees
- A 50/50 mix of the two.
The first comparison runs from September 2024 to August 2026; the second covers April 1992 to December 2002.
Case A: September 2024 to August 2026
Source: BSE (Sensex); MSCI (ACWI Net Total Return, USD). Sensex includes dividends.
- Sensex: About −4.5% a year, including dividends.
- Global equities: About +26.5% a year in rupee terms.
- 50/50 mix: Still about 24% above where it started, despite half the money sitting in a falling market.
For an Indian investor holding that exposure unhedged, rupee depreciation lifted the return to approximately 57.5% in rupee terms.
Source: FRED monthly-average USD/INR; MSCI ACWI Net (2024–26).
This period illustrates the opportunity cost of relying on one market, but it spans only two years. To understand how diversification might matter over a much longer investment horizon, it helps to look further back at India's own market history.
Case B: April 1992 to December 2002 — We’ve been here before
Source: BSE (Sensex); MSCI (World Gross Total Return, USD).
- Sensex: About −1.2% a year over 10.7 years, including dividends.
- Global equities: About +11.5% a year in rupee terms, even after three straight down years from 2000 to 2002.
- 50/50 mix: Roughly doubled, with half the money in a market that went nowhere for a decade.
Global equities were not immune to losses: MSCI World fell in each of the final three years, from 2000 to 2002. The distinction was that its full-period outcome remained positive while the Sensex had yet to recover its earlier peak.
Between April 1992 and December 2002, the USD/INR exchange rate moved from 28.90 to 48.15. In both periods, depreciation increased the rupee value of overseas investments.
Source: FRED monthly-average USD/INR; MSCI World Gross (1992–2002).
But there is an important historical qualification.
Indian residents could not access overseas portfolio investments through the Liberalised Remittance Scheme before its introduction in 2004. The 1992–2002 comparison is illustrative of the potential benefits of diversification, not a claim that the same portfolio was readily available to Indian investors at the time.
The case is for diversification, not against India
The Sensex's rise from 3,377 at the end of 2002 to its September 2024 peak is an increase of roughly 25 times in price terms. That is a proof of what long-term participation in Indian equities has delivered.
But the eventual recovery does not tell an investor how long the next recovery will take. Nor does it establish that global markets will consistently outperform.
International equities have their own drawdowns, valuations and currency risks; the three consecutive annual declines in MSCI World from 2000 to 2002 are a reminder of that.
The more useful question is whether a financial plan should depend entirely on one market delivering returns at the right time.
Owning thirty Indian stocks may reduce company-specific risk, but it does not remove exposure to the same domestic economy, currency or broad market cycle. Global diversification broadens the opportunity set, although it cannot eliminate losses or guarantee superior returns.
At Flameback, this is the rationale behind building global portfolios for families, HNIs and NRIs.
The objective is to build exposure across markets and currencies in line with an investor's objectives and risk tolerance.
The lesson from these two periods is that a market can create substantial wealth over decades while spending years below a previous peak. Diversification cannot determine when returns arrive, but it can reduce how much an investor's outcome depends on a single market cycle.
Data notes
- Sensex comparison periods: 27 September 2024–31 August 2026 and April 1992–31 December 2002.
- Sensex returns include assumed dividend yields; these are total-return proxies, not official Sensex TRI returns.
- Global returns use MSCI ACWI net total return for 2024–2026 and MSCI World gross total return for 1992–2002. The historical starting-period return is estimated.
- USD/INR figures use monthly-average Federal Reserve/FRED exchange rates. Global investments are unhedged.
- The 50/50 portfolio is buy-and-hold, without rebalancing. Taxes, transaction costs and LRS-related TCS are excluded.
- Sources: BSE, MSCI index data and factsheets, Federal Reserve/FRED, and secondary historical market reports.
Historical illustrations are not forecasts or guarantees of future returns.
Ashrith Rao is a Fund Manager at Flameback Capital (SEBI RIA INA200013798). Views expressed are the author’s own and do not constitute investment advice.
Ashrith Rao
Fund Manager, Flameback Capital
Ashrith Rao is a Fund Manager at Flameback Capital, a role he has held since February 2025. He oversees an offshore fund focused on Indian and U.S. markets, domiciled in Mauritius and run on long-short hedge fund strategies. Rao takes a quantitative approach to investing, building customised wealth solutions for high-net-worth individuals across a range of risk profiles. His expertise is market views on India, the U.S. and global capital flows.
Comments
Comments are not open on this story. Join the conversation by sharing it, or write to our editors.